
Tonbo Imaging IPO: Indian Sales Doubled as Exports Fell 93%
Company Analysis · Defence Electronics · 16 October 2026
The Tonbo Imaging IPO opened on 15 October 2026 with an unusual reversal behind it. In FY26, the Bengaluru defence electronics maker’s sales to Indian customers more than doubled to about ₹337.5 crore, while export revenue fell from ₹307 crore to ₹20 crore, according to its red herring prospectus (RHP) dated 10 October 2026. Total revenue still dropped 22.7% to ₹362.65 crore. The issue closes on 19 October. (One crore is ten million.)
What does the Tonbo Imaging IPO offer, and who receives the money?
The Tonbo Imaging IPO is a ₹852.18-crore offer for sale of 1,21,74,046 shares at ₹665 to ₹700 each, so every rupee raised goes to selling shareholders and none to the company. At the upper band, the company is valued at about ₹4,010 crore, roughly 79 times FY26 earnings by analyst calculation. Allotment is due on 21 October and listing on 23 October.
Half the issue is reserved for institutional buyers, 35% for retail investors and 15% for non-institutional investors. On the first day the book was subscribed 4.00 times. The grey market premium, an unofficial and unregulated indicator, stood near 71% of the upper band.
In the Tonbo Imaging IPO, two investor entities, CEAQ Technologies Private Limited and CEAQ Technologies Pte Limited, sell about 75% of the shares on offer, and the three promoters sell about 16%. Because there is no fresh issue, the listing does not change the company’s balance sheet. It changes visibility with defence buyers and the company’s future access to public capital.
Why did Tonbo’s exports fall while Indian orders doubled?
Revenue from operations rose from ₹428.19 crore in FY24 to ₹469.08 crore in FY25, then fell to ₹362.65 crore in FY26. The prospectus attributes part of the decline to delays in executing international orders linked to the West Asia conflict, including a ₹51.44-crore export order now expected to ship in FY27. Over the same year, sales to Indian customers rose from about ₹157 crore to ₹337.5 crore.
| Metric (₹ crore) | FY25 | FY26 |
|---|---|---|
| Revenue from operations | 469.08 | 362.65 |
| Domestic sales (approx.) | 157.0 | 337.5 |
| Export sales | 307.34 | 20.21 |
| Export share of revenue | 65.52% | 5.57% |
| Profit after tax | 72.76 | 50.88 |
| Confirmed order book at year-end | 218.61 | 279.02 |
The domestic and export lines sum to slightly less than revenue from operations. Source: Tonbo Imaging RHP dated 10 October 2026, converted from ₹ million.
The mix shifted from nearly two-thirds exports to almost entirely Indian customers within a year. The RHP shows platform systems, the larger integrated products, rising from ₹12.70 crore in FY24 to ₹144.81 crore in FY26, or 39.9% of revenue, while tactical systems fell from ₹362.30 crore to ₹211.68 crore. Customer concentration eased as well: the largest customer accounted for 13.78% of FY26 revenue, against 57.07% in FY25.
Can the ₹314-crore order book rebuild Tonbo’s export business?
Tonbo’s confirmed order book stood at ₹314.24 crore across 36 orders on 30 June 2026, of which ₹82.37 crore came from six overseas orders. That equals about 87% of FY26 revenue. Inc42’s reading of the Tonbo Imaging IPO prospectus also reports ₹118.15 crore of new orders between July and September.
The risks sit in timing and cash. Financial media analysis of the filing shows a net loss of ₹17.74 crore in the first quarter of FY27 and that about 79% of FY26 revenue arrived in the second half of the year, so quarterly numbers will be uneven. Operating cash flow was negative in both years, at ₹136.1 crore in FY25 and ₹63.22 crore in FY26, against profits of ₹72.76 crore and ₹50.88 crore. Receivables and cash conversion, more than headline orders, will show whether the model scales.
What does a listed private electro-optics maker mean for India’s defence industrial base?
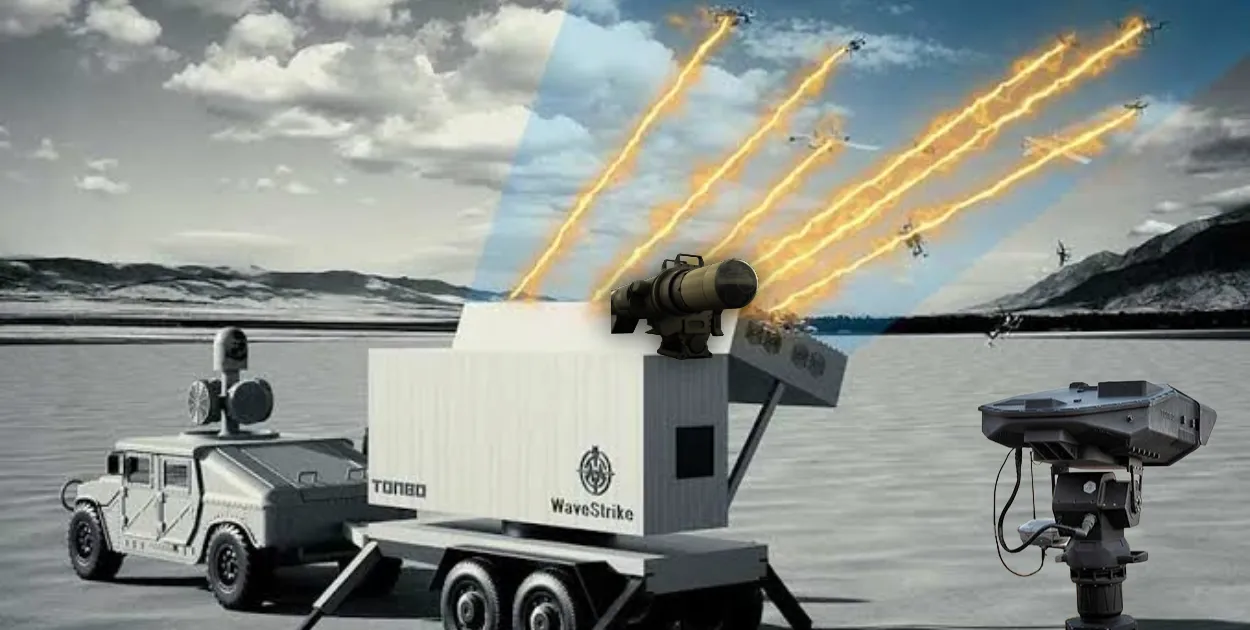
Tonbo designs thermal imaging, electro-optic and embedded vision systems, and analysts point to missile seekers and counter-drone payloads as growth areas. The Tonbo Imaging IPO adds a privately held design house to a market long associated with state-owned names such as Bharat Electronics Limited (BEL).
Bengaluru has seen this arc before. BEL was set up there in 1954 to equip the Army with electronics. Seven decades on, a privately held Bengaluru firm founded in 2003 by technologists with earlier US Department of Defense and Sarnoff Corporation experience is asking public markets to price its design work. It moved into defence products in 2012.
The prospectus describes its systems as non-ITAR, meaning free of the US International Traffic in Arms Regulations, and analysts read it as outlining a push to widen sales across South-East Asia, Africa, the Middle East, Europe and South America. For overseas buyers, non-ITAR status is a supply-chain design choice, and the push fits a domestic market that the Ministry of Defence says produced ₹1.78 lakh crore of defence output in FY26.
TES has tracked the wider layer of private Indian defence electronics suppliers and how listed peers such as Astra Microwave have been valued. For a deeper look at the policy push, see TES’s analysis of MoD’s drive to move defence MSMEs to Tier-1.
What should investors and defence watchers track after allotment?
Three tests follow the Tonbo Imaging IPO. The first is whether the ₹51.44-crore deferred export order ships in FY27. The second is whether the ₹82-crore overseas book converts without another delay. The third is whether cash flow catches up with profit, as Inc42’s reading of the RHP also stresses.
TES assessment: Indian demand carried Tonbo through a year in which exports stalled, and that domestic base is the firmest part of the story. If the deferred export order and the overseas book convert, FY27 would show a company with a doubled domestic line and a restarted export line. If they slip again, the valuation will rest on Indian orders alone.
Source note: Tonbo Imaging Red Herring Prospectus dated 10 October 2026; exchange IPO data to 15 October 2026; company disclosures via Business Standard; quarterly and valuation figures from financial media analysis.